
The mid-cap buyout segment offers a unique sweet spot for investors. By focusing on the size of the company rather than the size of the fund, it’s possible to find attractive risk-adjusted returns, shorter holding periods, and high exit optionality.
Our recent discussions with industry stakeholders highlight a clear trend in private equity: increased focus on mid-cap buyouts. We agree with this sentiment, having invested in the mid-cap space for over two decades through our Evli Private Equity Fund-of-Fund structures.
The private equity landscape is broad and can be divided into three main segments, Buyout, Growth, and Venture Capital, with the first being the largest. In this article, we slice the Buyout segment by size and show why the mid-cap segment is an attractive place to operate in.
Executive summary
- Business size, rather than fund size, is a more intuitive metric for determining which size segment a manager belongs to.
- The mid-cap segment is broad enough to allow for selective fund picking.
- The return characteristics of the mid-cap segment are attractive in terms of median returns and downside risk.
- Lower management fees in larger funds mitigate but do not eliminate the outperformance of smaller funds.
- The strategic value of exit optionality and multiple uplift are the main causes for the outperformance in the small- and mid-cap segments.
Business size is a superior metric
But how do you define mid-cap when everyone has their own definitions, and even the object of determination may vary between LPs (Limited Partners) and GPs (General Partners)?
Some LPs use fund size as a metric to categorize managers into buckets such as large-cap, mid-cap, or small-cap. While this is a convenient way to categorize managers based on size, it can also be misleading. Imagine a manager that aims to hold 10 businesses in their fund, while another targets 30. Although both may raise a €6 billion fund, the size of the underlying businesses will differ significantly.
We believe business size, rather than fund size, is a more intuitive and accurate metric for determining which segment a manager belongs to. The graph below shows that there is a return difference between large and small businesses. We have categorized businesses into size segments based on their enterprise value at time of entry (1):
Figure 1: Gross Multiple on Invested Capital (MOIC) - Median
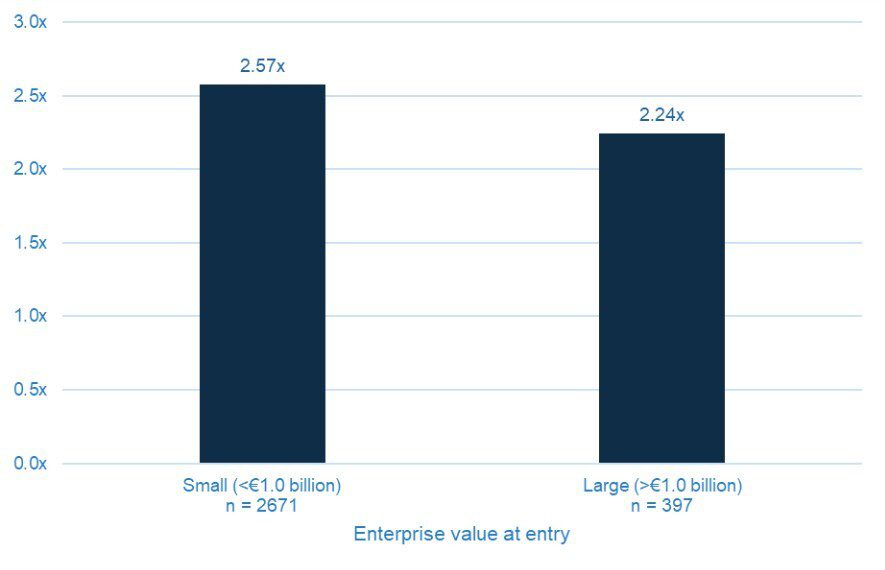
Source: Evli FoF database (2)
Identifying the mid-cap sweet spot
We define the mid-cap segment as businesses with enterprise values of about €/$100 to €/$1,000 million, which typically translates to fund sizes of about €/$500 to €/$6,000 million (3). By focusing on this part of the market, we cover about one third of the total buyout universe (4, 5). In North America and Europe, 100–150 managers typically raise a mid-cap fund in any given year (5). The size of the mid-cap segment allows a fund picker to be highly selective, assuming the investment pace is not too aggressive.
Figure 2: Buyout funds by vintage and size segment
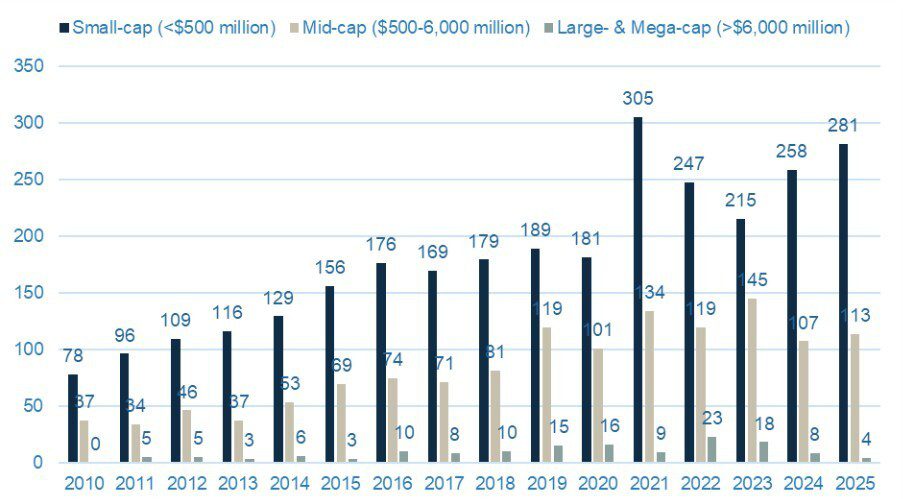
Source: Preqin (Buyout funds with a primary focus on Europe and North America, size segment based on fund size in US dollars)
Attractive historical returns and better downside protection
Why do we choose the mid-cap segment over small- or large-cap? One of the reasons is obviously the favorable historical return* characteristics of the mid-cap segment, which is illustrated in the graph below. The small- and mid-cap segments offer similar median returns, while the large-cap segment trails significantly below.
While median returns are similar between the small- and mid-cap segments, focusing on the latter provides better downside protection. Admittedly, a mid-cap investor gives away some upside to achieve this downside protection. The large-cap segment offers less upside and surprisingly also more downside risk than the mid-cap segment.
Figure 3: Gross MOIC quartiles by size segment
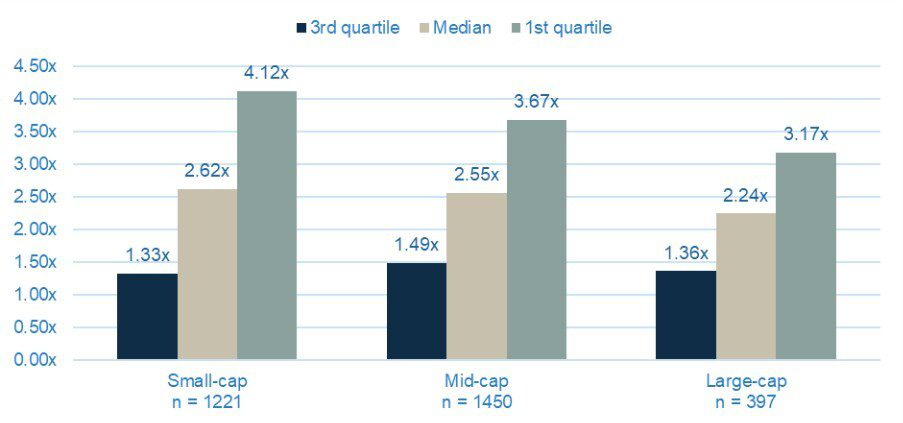
Source: Evli FoF database (2)
It is important to note that we are looking at gross returns. Larger funds generally have lower management fees, which mitigates the gross return disadvantage, and LPs ultimately care about net returns. However, the difference between management fees is not large enough to compensate for the lower median returns in the large-cap segment.
Figure 4: Management fees by size segment
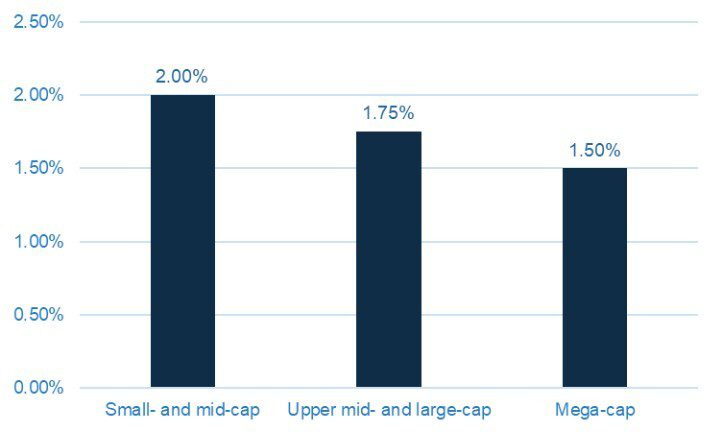
Source: Evli
Exit optionality and multiple uplift drive performance
While the historical return characteristics are attractive, it is even more relevant to understand the causes driving them. We believe two main factors, strategic exit optionality and multiple uplift, will continue to hold true.
There is strategic value in being able to sell a mid-cap business to a larger sponsor or strategic buyer rather than being dependent on the IPO (initial public offering) market. Our data shows that about 25 percent of businesses that have been bought at an enterprise value of over €1.0 billion were exited via an IPO. The reason is obvious: the larger the business is at entry, the more limited the potential buyer universe is at exit, assuming the business has grown. The list of relevant sponsors and strategic buyers diminishes, and eventually an IPO is the only option.
Figure 5: IPO exits by size segment
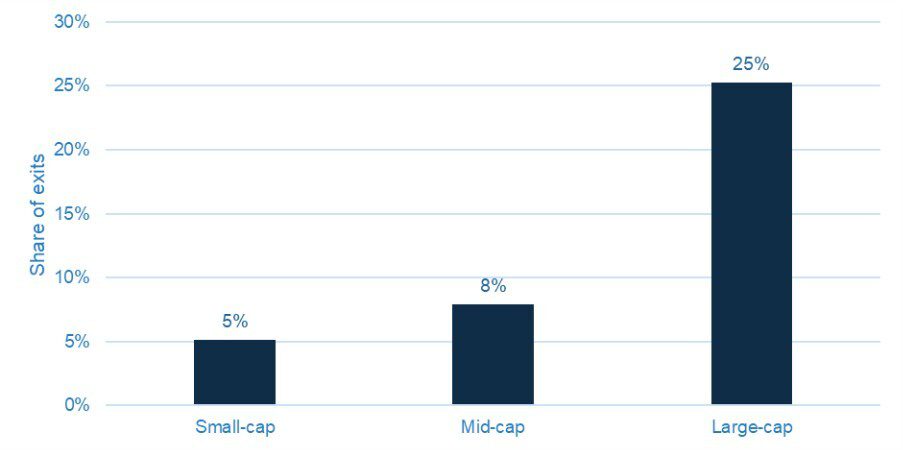
Source: Evli FoF database (2)
As we have seen in recent years, the IPO markets can close for extended periods of time as they did during 2022–2024. This prolongs holding periods of investments whose only plausible exit route is an IPO, which is truer in the large-cap segment than the others. The median holding period of a realized large-cap deal is about one year longer than the holding period of a mid-cap deal.
Figure 6: Holding periods of realized deals
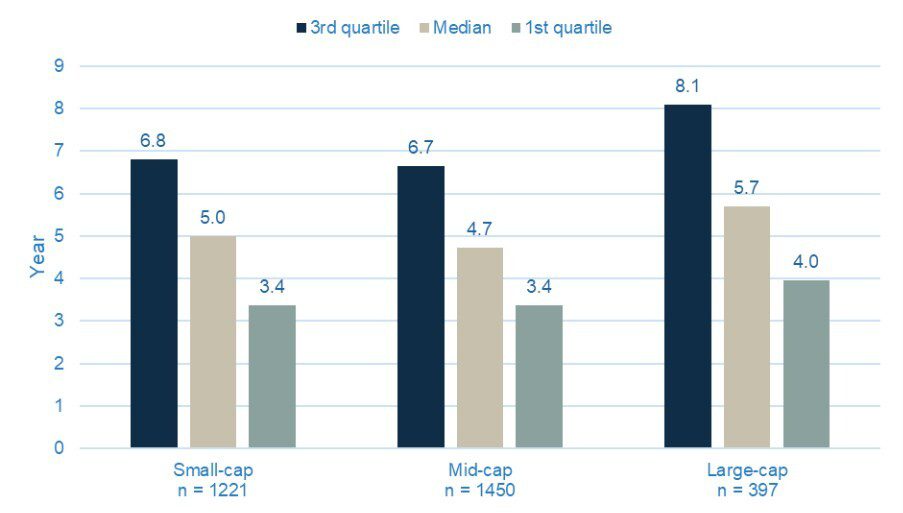
Source: Evli FoF database (2)
The shorter holding periods in the small- and mid-cap segments also imply earlier DPI (Distributed to Paid-In capital) to LPs. The difference in holding periods is exacerbated further when comparing the intersection of the 3rd and 4th quartile. It has taken almost 1.5 years longer to exit the 75th percentile large-cap deal than the corresponding mid-cap deal. The statistics are also favorable for mid-caps compared to small-caps although only by a narrow margin.
Another attractive trait of small businesses is that they trade for lower multiples and use less leverage than large businesses. This is as it should be in a functioning capital market, as larger businesses generally have better quality characteristics like more diversified revenue streams (6), less key-person risk, higher quality management teams, and greater institutionalization.
However, this valuation difference between small and large businesses creates an interesting dynamic for sponsors operating in the small- and mid-cap space: if a sponsor can grow the business and improve the characteristics mentioned above, it should lead to a higher valuation multiple at exit.
Figure 7: Entry EV/EBITDA & Net debt/EBITDA
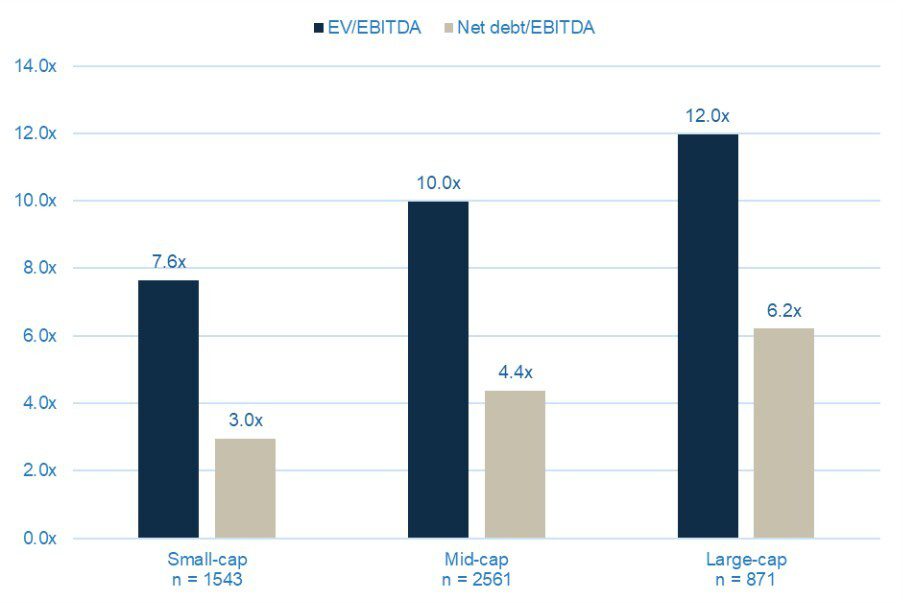
Source: Evli FoF database (2)
The tailwind continues
The great mid-cap tailwind has served LPs and GPs well in the past, and we expect it to continue doing so in the future.
While this article focuses on the advantages of the mid-cap segment compared to the other size segments, it needs to be stated that there are many exceptional managers in the small- and large-cap space that have achieved outperformance compared to mid-cap managers. We also have our favorite picks from each segment, which complements our allocation to mid-cap managers.
Want to discuss the insights or data presented in this article in more detail?
Reach out to out experts
Interested in alternative investments? Read more blogs:
Co-investments in private equity: lemons or gems?
Evli’s co-investment strategy: opening the door to direct private equity deals
Footnotes
(1) Assuming we all agree that business size is the object we should use to determine size, which metric should be used? The most common metrics are enterprise value and EBITDA. In most cases these metrics should generate the same outcome so the choice between them becomes irrelevant. One can debate whether alternative metrics such as revenue or book value should be used as the defining metric of business size. The metric is also dependent on the stage or sector of the business. A less mature unprofitable or break-even business cannot use EBITDA as a size metric. The size of a financial institution, such as a bank or an insurance underwriter, is better defined by book value due to the capital intensive and liability driven business model.
(2) Evli’s database consists of about 5,000 businesses of which over 3,000 have been fully realized. Small-cap is defined as businesses with an enterprise value of up to €100 million, mid-cap with an enterprise value of €100-1,000 million and large-cap with an enterprise value of over €1,000 million.
(3) A rule of thumb for translating fund size to business size (or vice versa) requires a few assumptions and inputs: Target fund size, number of target holdings, how much of the fund is allocated to investments, average ownership acquired, Loan-to-Value at entry, and (if necessary) co-investment offering. As mentioned earlier, fund size is only the first and incomplete screen on identifying mid-cap managers.
(4) About 30 percent of buyout funds (count) raised since 2010 in North America and Europe have fallen within this range according to Preqin.
(5) Funds with a reported fund size in Preqin. There may be managers that do not report their fund size. These will not show up in the size segment data.
(6) Revenue streams can be diversified by, for example, end market, customer, product, service, and country.
* Historical returns are no guarantee of future returns. The value of an investment may rise and fall and the investor may lose some or all of the capital invested. The contents of this article should not be considered as investment advice and should not be relied upon in making an investment decision.


