We were recently invited to present our research on the value of in-person investor meetings to the CFA Institute. This article provides an abbreviated summary.
View a recording of the webinar here >
We meet every company before we invest
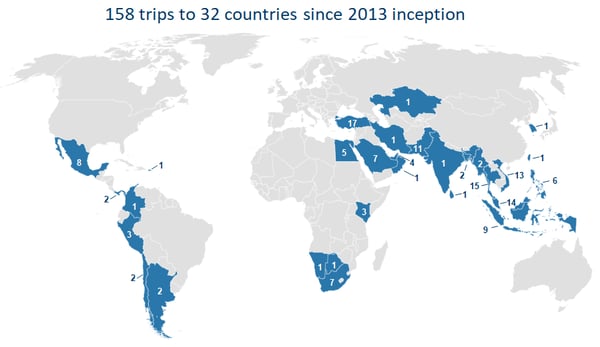
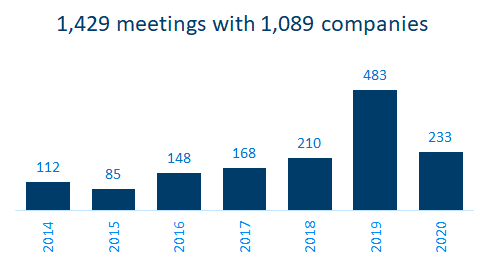
When we launched the Evli Emerging Frontier fund seven years ago, we promised our investors that we would never invest in any company before meeting management face-to-face. Since that time, our small team has met over 1,000 companies in emerging markets.
The fundamental law of active management
Information ratio is the return above the benchmark divided by the standard deviation of those active returns. Among all 22 emerging frontier funds we’ve identified which have track records of at least 7 years, our fund has ranked second highest in terms of returns and highest in terms of information ratio. We believe that our commitment to travel has contributed to our ability to outperform the closest index to our strategy as well as our peer set.
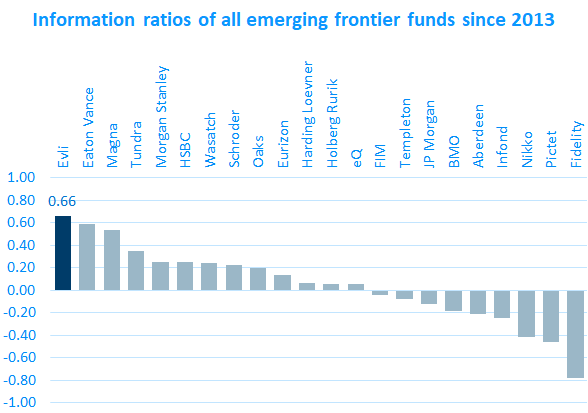
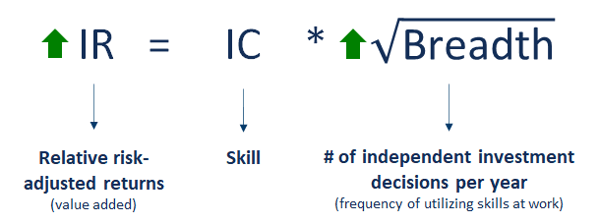
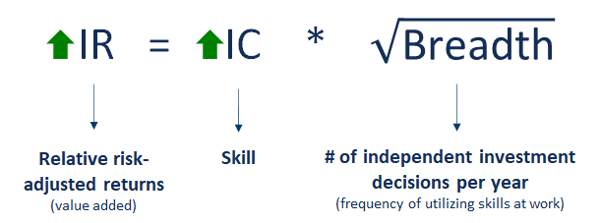
The fundamental law of active management states that the information ratio is a function of the information coefficient, or a manager’s skill, and the breadth, or number of independent investment decisions made per year. We view company meetings as enabling us to make more independent investment decisions, which contributes to an increased information ratio.
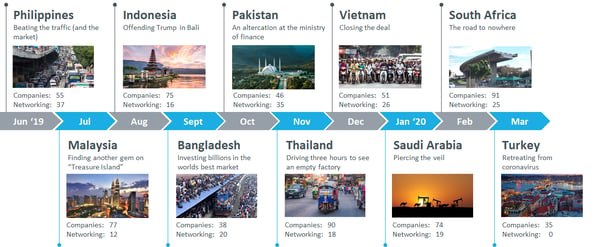
12 Markets in 12 Months
Last June we started a project to immerse ourselves in our markets by living in 12 different emerging markets for one month each. We made it to our 10th country, Turkey, before the Covid-19 pandemic forced us to suspend the project. In total we met 632 companies as well as had 208 networking meetings with CFA society presidents, Wharton alumni, local investors, central bank governors, finance ministers, stock exchange presidents, SEC commissioners, and others.
Academic evidence suggests these meetings can contribute to alpha
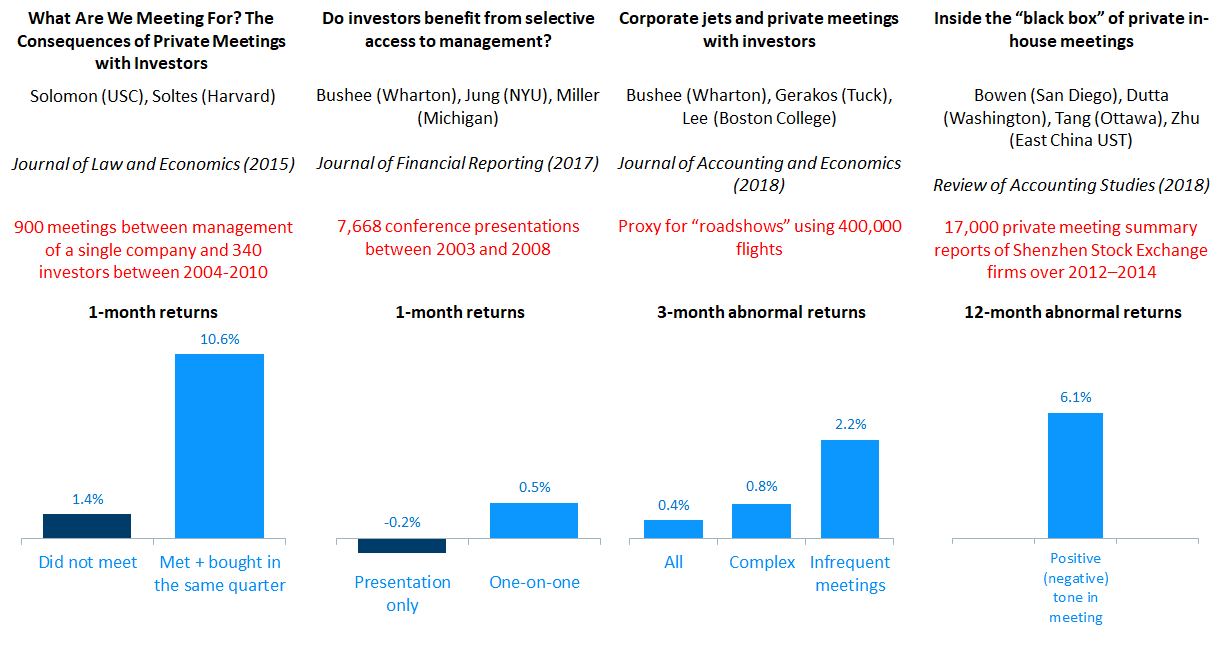
Despite a dearth of academic work on the value of private investor meetings, we have identified four innovative papers which shed light on the question.
The first study was published in 2015. Researchers convinced a single company to give them access to a list of all 900 meetings they had with 340 investors over 6 years. Their research found that those investors which bought shares in the same quarter they met management outperformed other investors by 9% over the following month.
Another study used data from one-on-one meetings at conferences between investors and participating companies and also found outperformance by those investors that invested immediately after meeting management.
A third study looked at roadshows and found that not only did investors which participated enjoy abnormal returns, those that invested in companies which were complex or which infrequently meet investors did even better.
A final study which analyzed private meeting summary reports from China found that those with a positive tone outperformed those with a negative tone.
Our method
Since starting our hiatus from travel in March, one of the things we’ve been doing is analyzing the data we’ve collected from the 1,500 meeting requests we made to companies, and the 632 meetings we conducted, including 323 CEO meetings. From our study, we find compelling evidence that CEO meetings can provide signals of future stock price returns.
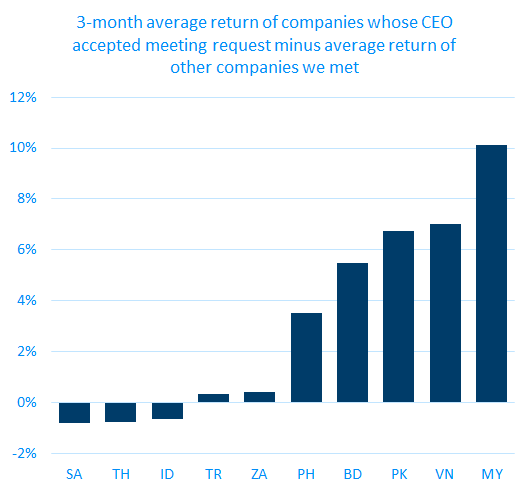
Signal 1: CEO’s willingness to meet
Then we compared the average return of the companies whose CEOs accepted our meeting over the three months following our trip with the average of the companies whose CEOs delegated our meeting to someone else, we found a potential signal.
Our hypothesis is that CEOs which are confident about their upcoming quarter’s prospects are excited to sit down and brag about their business. However, if they know the next quarter will be bad, they probably don’t want to convince new investors to start a position right before the stock price collapses. Why not just let the investor relations officer take the meeting?
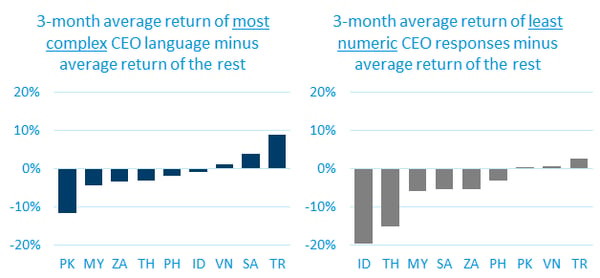
Signal 2: CEO’s language transparency
Another variation we noticed was that some CEOs used more complex language while others used more transparent language. And second, we counted the percentage of numbers cited in the CEO’s response. For most countries, companies with CEOs who used more transparent language with more numbers on average outperform those which used more complex language. Our hypothesis is that those CEOs are more confident about their company's prospects.
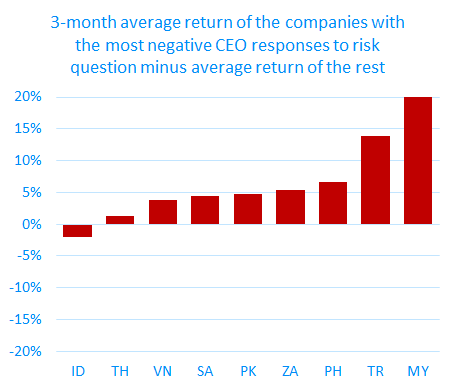
Signal 3: CEO’s tone when addressing risks
When we asked about risks, we noticed that there was substantial variation in the responses as well. While some CEOs openly discussed risks, others were more reserved. We asked every company we met: “What are the most likely things that could go wrong over the next 12 months that could cause the value of the business to decline?” We analyzed the percentage of negative words spoken in response to such risk questions. While our intuition was that CEOs with more negative responses would perform more poorly, it was in fact the opposite. Our hypothesis is that CEOs which are more confident about their prospects may be more willing to openly talk about risks.
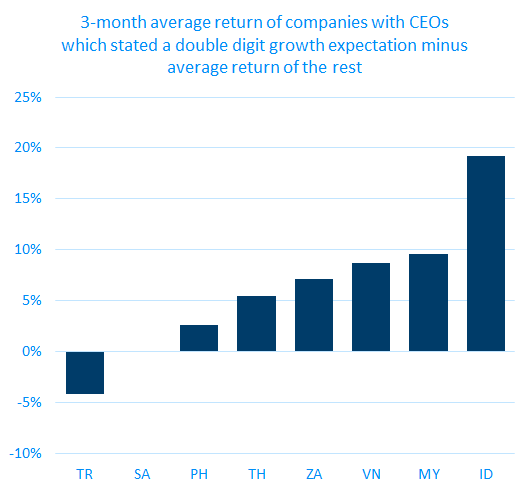
Signal 4: CEO’s expectation of earnings growth
We also found that CEOs’ stated expectations for growth might be a signal.
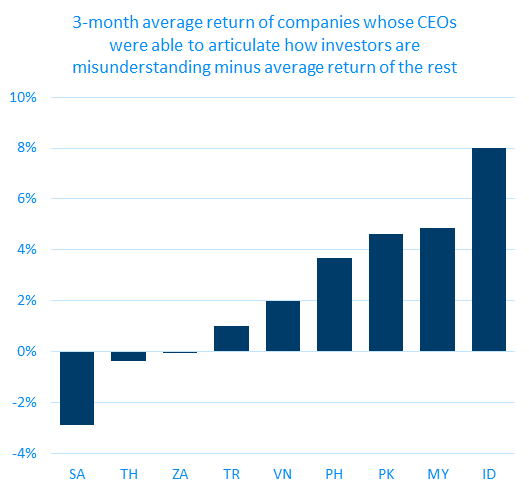
Signal 5: CEO’s ability to articulate how investors are misunderstanding
We asked every company we met: “How are investors misunderstanding you right now? And what is the critical information they are missing?” This might be the single most important question we ask any CEO, and we found that many companies struggled to answer this question. And perhaps it’s no surprise: since even frontier markets are relatively efficient, we shouldn’t expect investors to misunderstand most companies. But we don't invest in most companies. And if investors are not misunderstanding a company, they probably aren't mispricing it. And we are only looking to invest in companies which are being undervalued.
We manually coded all of the responses to this question, classifying those answers which we believed could be reasonable cases of investor misunderstanding. And we found this to be a fairly strong potential indicator of returns over the following three months.
Measuring success
There are two ways to measure the success of our 12 Markets in 12 Months project. The first is short-term fund returns. Our fund has outperformed the closest index by over 20% since we started the trip and met 632 companies, which places us in the top three funds in our peer set of 34 emerging frontier funds YTD. And nearly 100% of this return over the past year has come from the companies we added to the portfolio as a result of our trip. This has essentially come from increasing breadth.
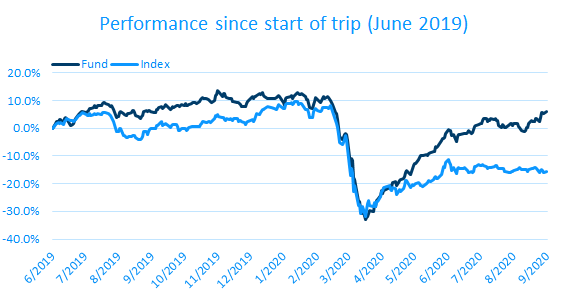 EEF vs. MSCI Emerging Markets Equal Country Weighted Index
However, the longer-term success of the project will be measured through the increased information coefficient from the lessons we are learning as a result of these studies. We hope this research will increase our stock selection skills.
To learn more...
In the CFA Institute webinar, we share specific examples from each of the five potential signals we mentioned here. Plus we also discuss other benefits we believe these meetings provide such as insight into management and ESG practices, access to follow-up and active ownership opportunities, and the wider knowledge of the investment universe which can be quickly accessed and acted upon when opportunities arise. Finally, we answer questions from live attendees.